Seven Brothers
Following up on Contours, A Mathematical Coloring Book, here's another contour plot for coloring:
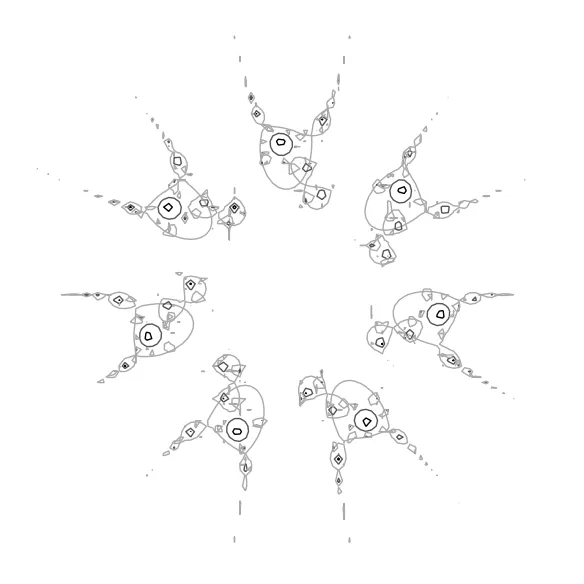
The PDF version is here. The copyright is Creative Commons Attribution-NonCommercial-ShareAlike 4.0 International.
Like the other contour plots in the book, this plot was created using Sage. Here's the Sage notebook code, in case you want to play with the plot.
a = exp(2*pi/3*I)
f(z) = sin(z^7 + a)
f = fast_callable(f, domain=CDF, vars='z')

def ff(x, y):
    return f(CDF(x, y)).real(), f(CDF(x, y)).imag()

def iterate(func, n):
    def g(x, y):
        for i in range(n):
            x, y = func(x, y)
        return abs(CDF(x,y))
    return g

G = Graphics()
for j in range(1, 6):
    G += contour_plot(iterate(ff, j), (-1.8, 1.8), (-1.8, 1.8),
      contours=[0.2, 0.5, 1], fill=False)
G.show(frame=True, axes=False, aspect_ratio=1)
Why no comments? Public comments take too much time to moderate and maintain, time better spent playing outside, but you can still email me private comments by clicking the 'Comment' link above.